TALLA Visualizer
2024A desktop application for visualising and analysing indoor localisation data from a UWB system, built to surface the anomalies that raw logs hide.
1 / 8
The project
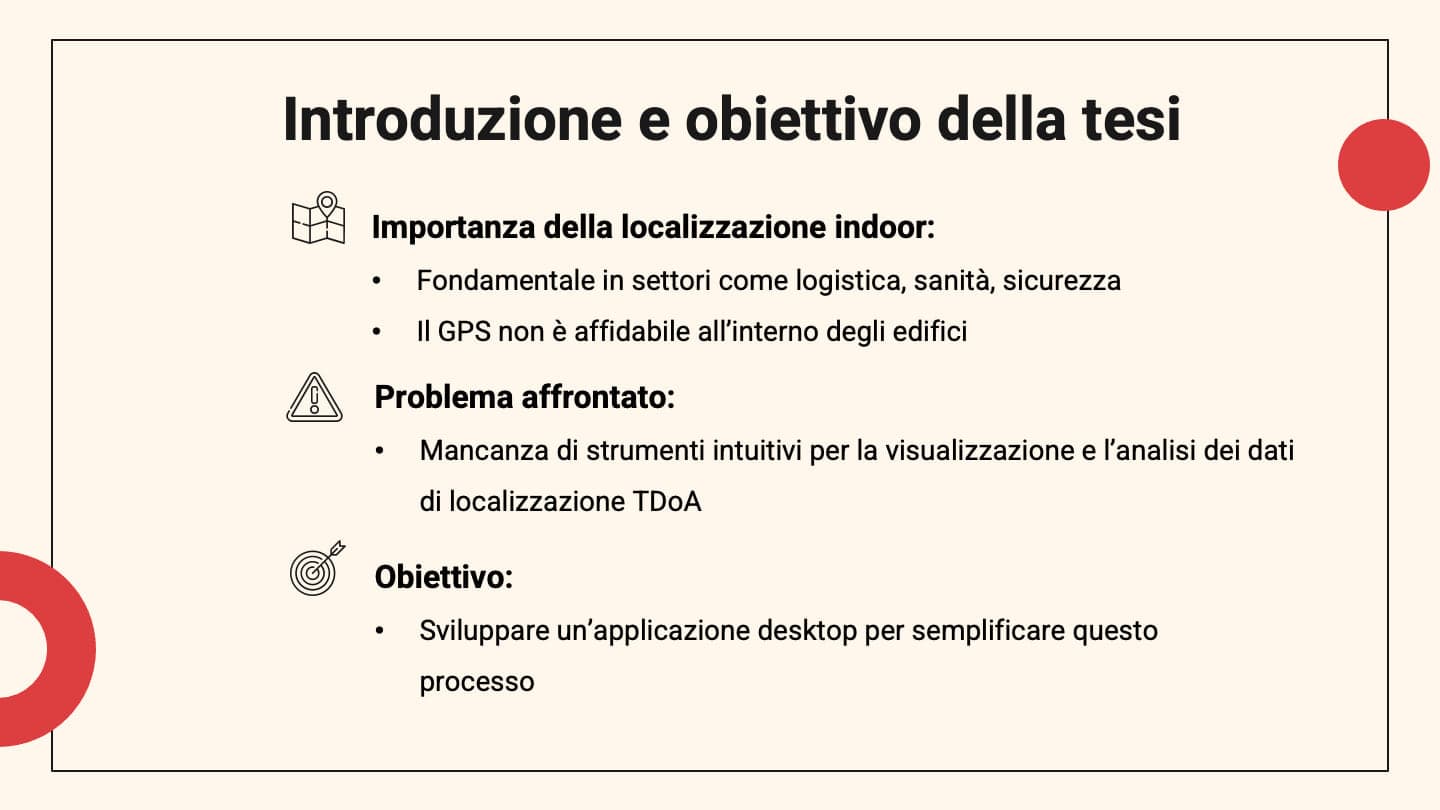
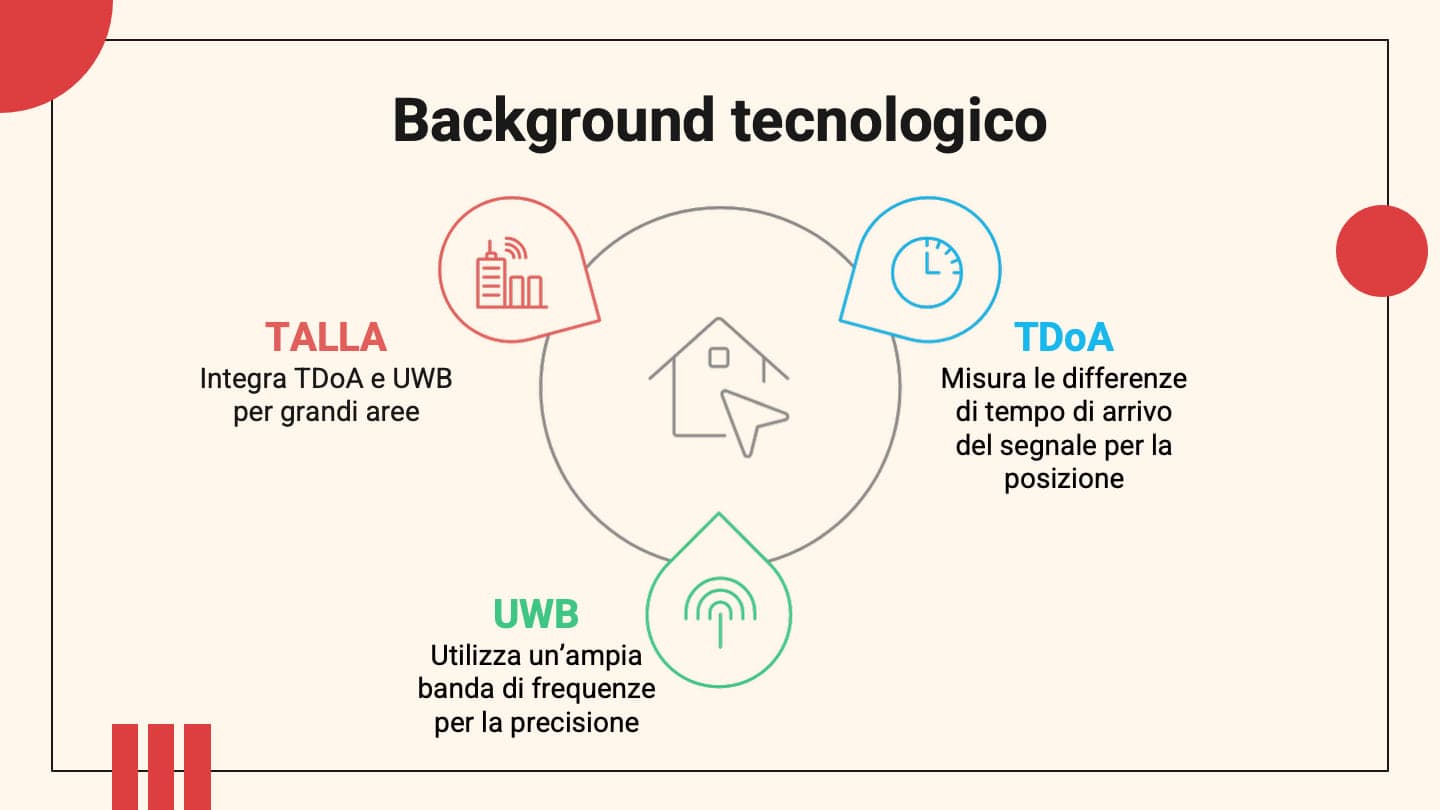
GPS stops where the open sky stops. Indoors you need something else: TALLA, the research group's system, locates Ultra Wideband tags by measuring the difference in signal arrival times across multiple anchors. The result is accurate, but it arrives as CSV traces hundreds of thousands of rows long, where understanding why a position is wrong means reading numbers by hand.
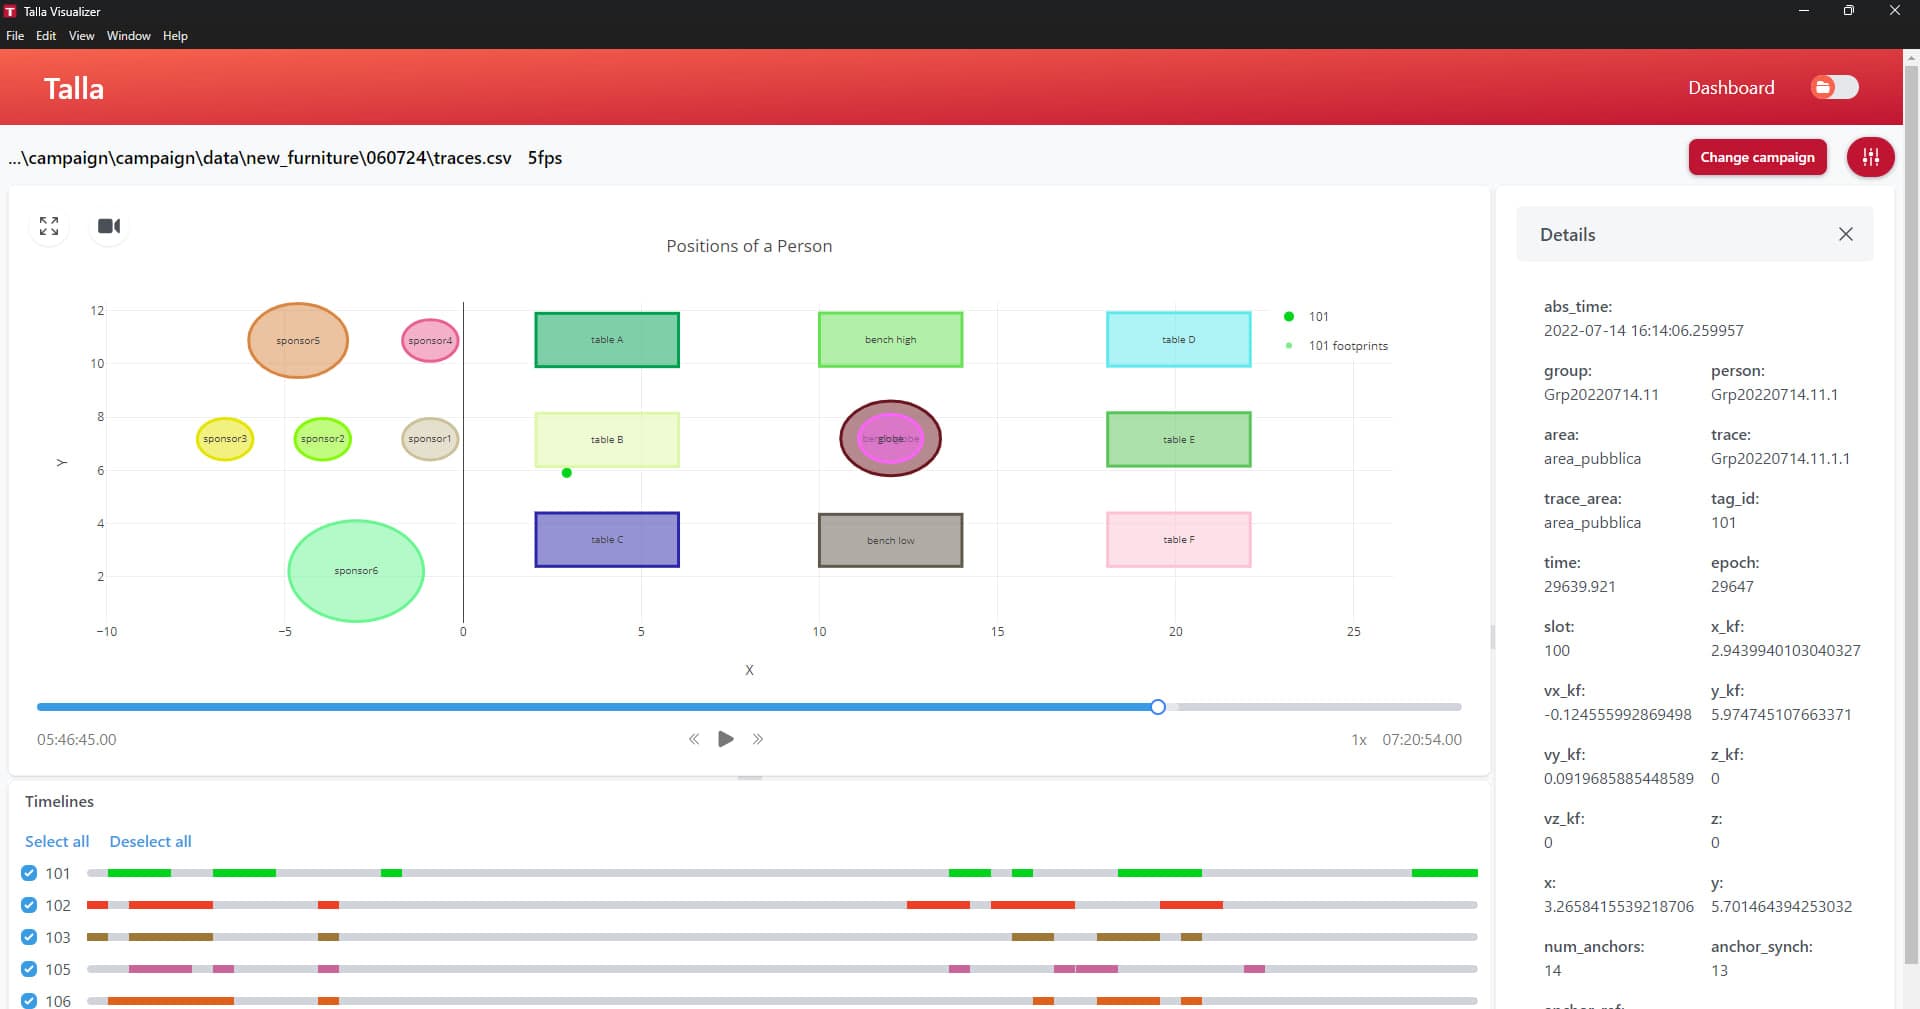
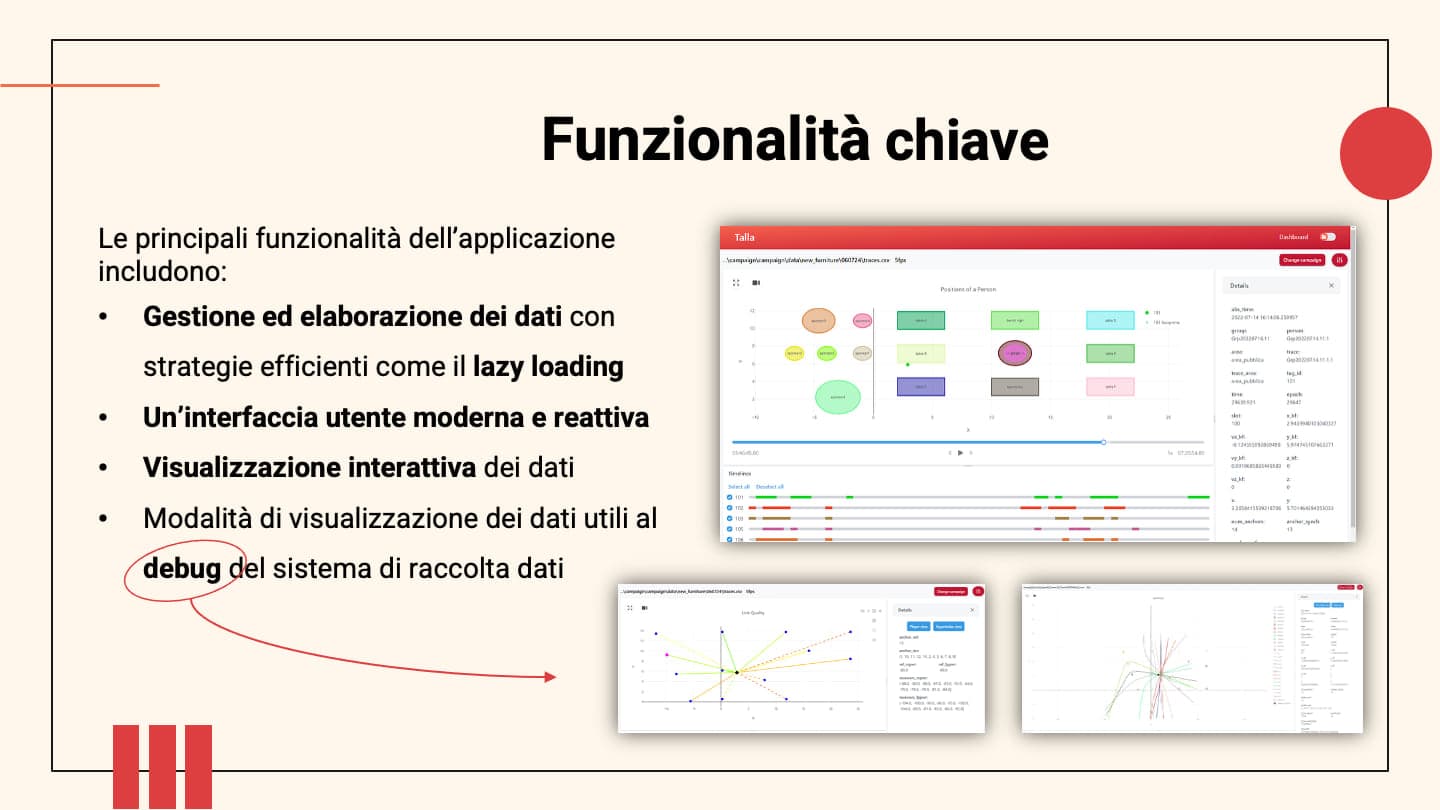
TALLA Visualizer turns those traces into a scene you can navigate. The floor plan with furniture and obstacles sits underneath, tags move along a timeline with a variable-speed player, and clicking a tag opens a panel with everything debugging needs: synchronisation epoch and slot, received and first-path signal power, Kalman-filtered coordinates next to raw ones, and the list of anchors that received that packet.
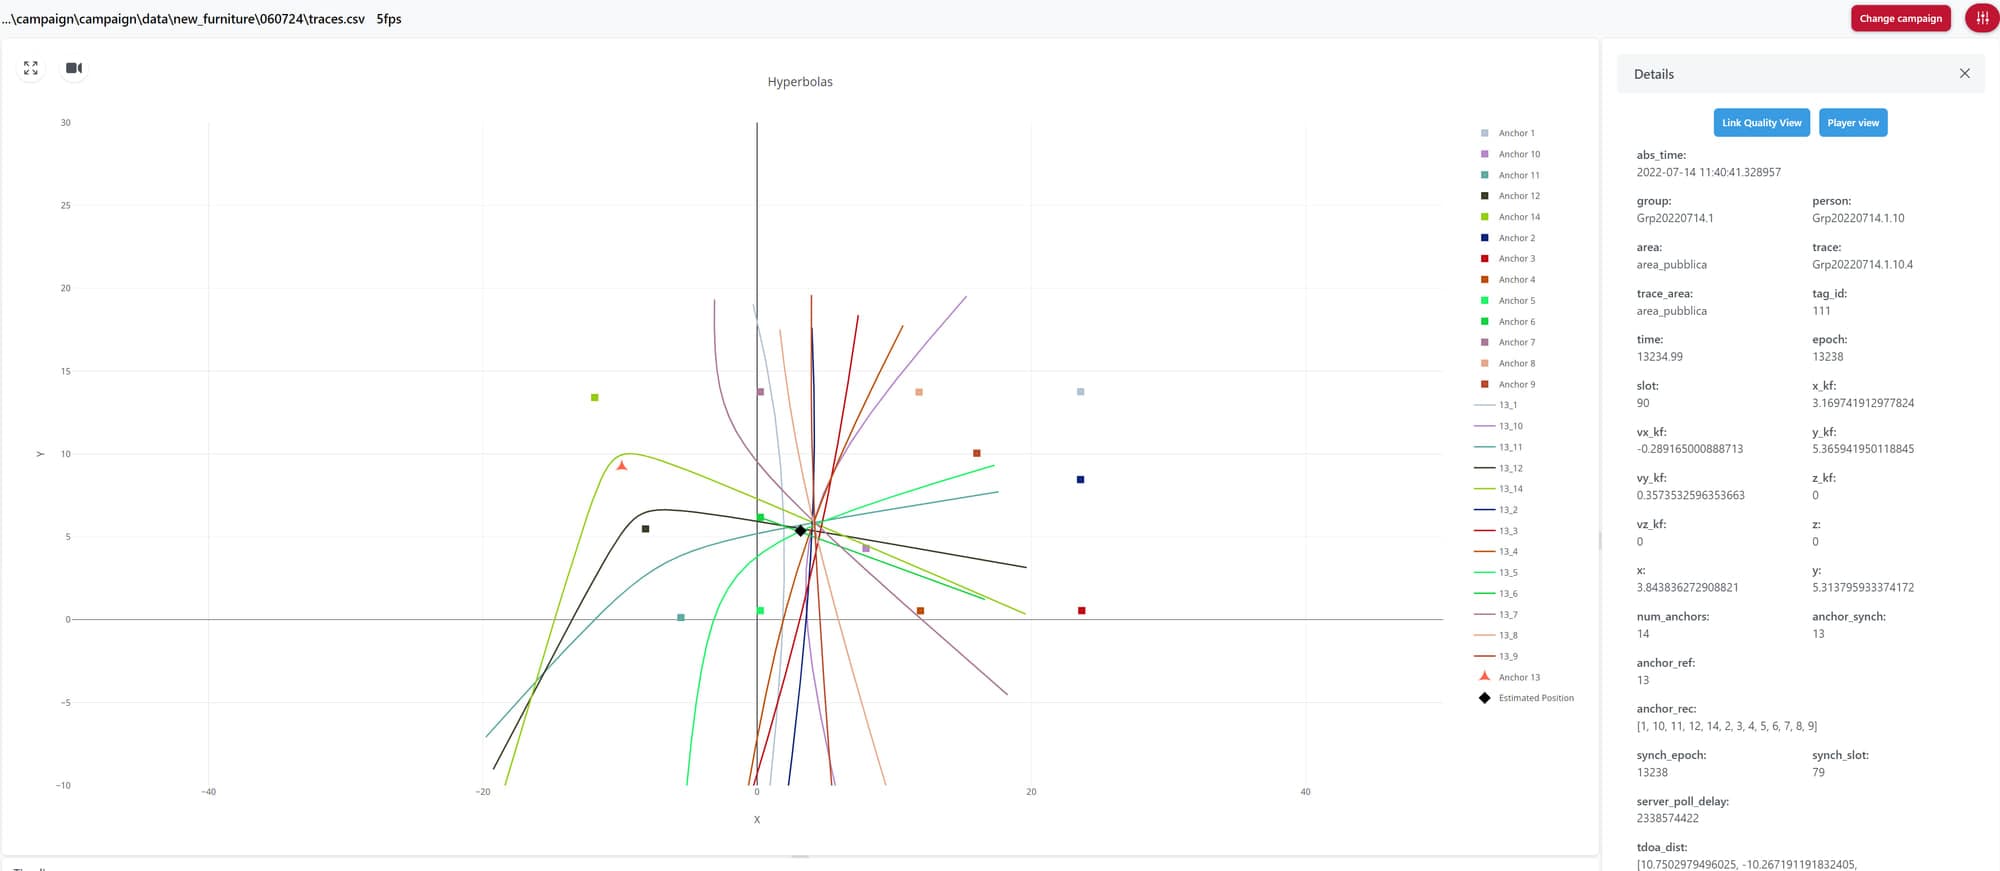
The hyperbola view shows the method itself: each pair of anchors produces a curve of points at constant distance difference, and the estimated position is where the curves converge. When one of those curves sits wrong, you can see at a glance which anchor is misbehaving.
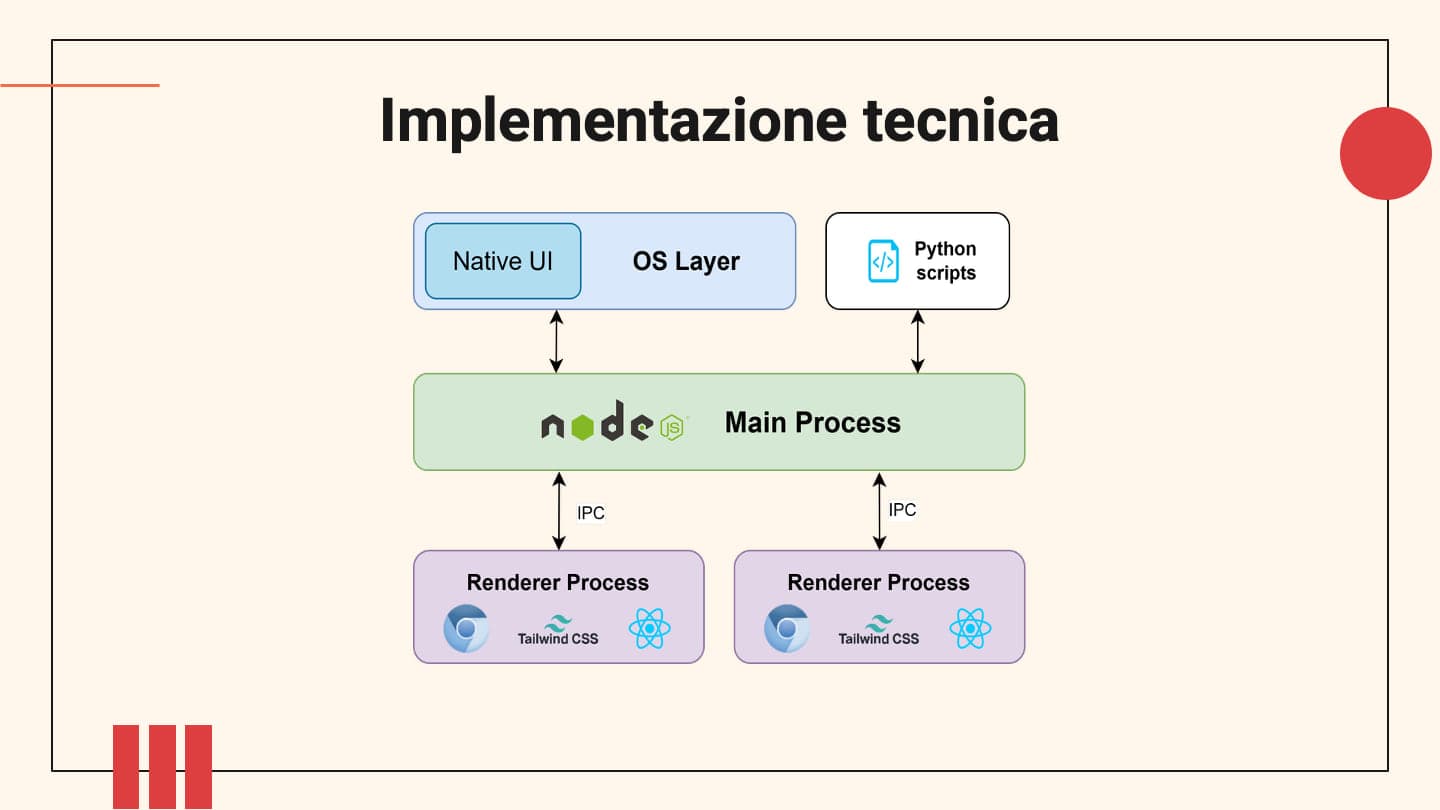
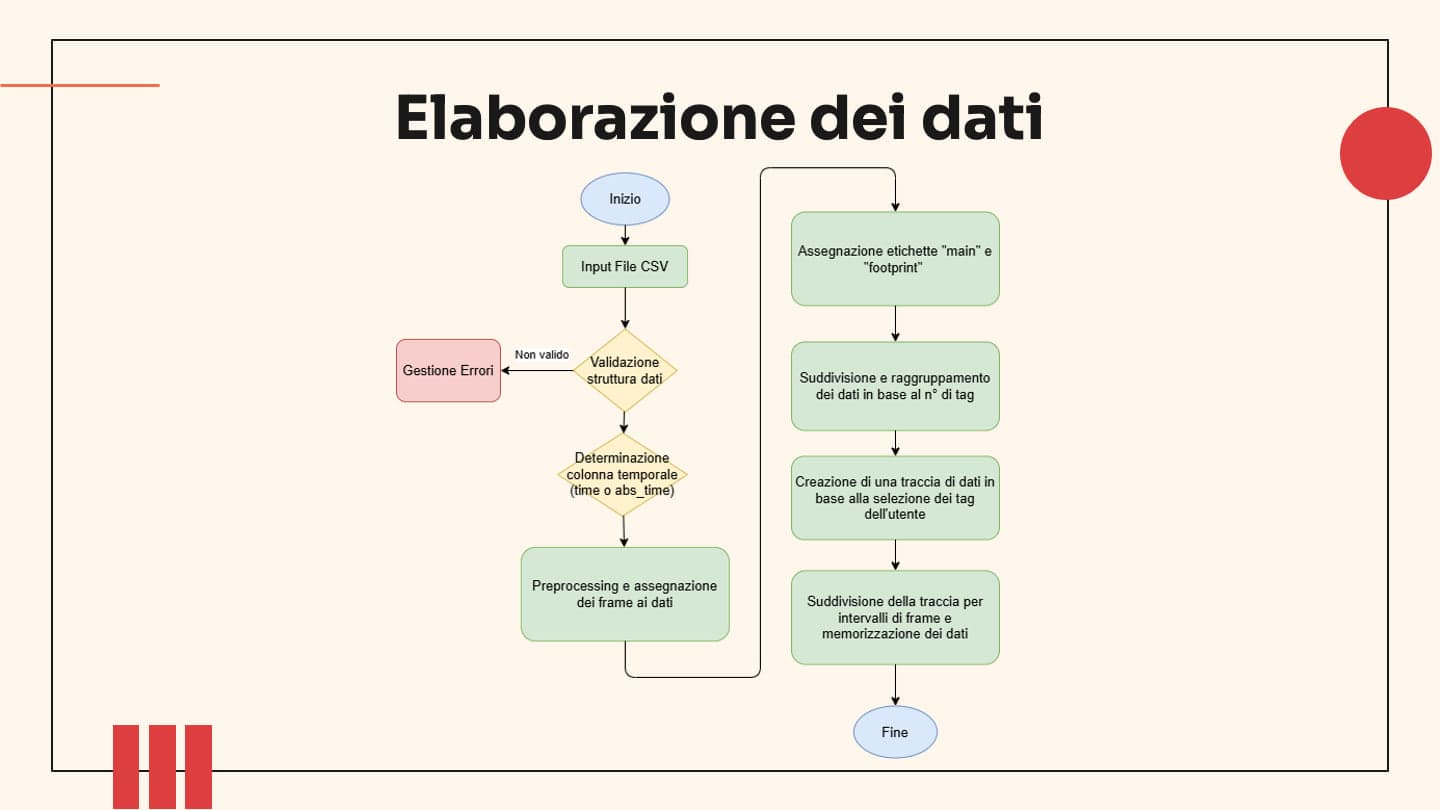
The architecture splits the load: a Node.js main process talks to the operating system and runs the Python scripts that process the CSVs with Pandas, while renderer processes handle the interface. The two sides communicate over IPC, so heavy dataset processing never blocks the UI. Lazy loading and frame-rate-based segmentation keep memory use low even on long capture campaigns.
The application was tested on Windows and Linux and refined by collecting feedback from the people who actually use it, the researchers in the group.